Cards In This Set
| Front | Back |
|
10.1.1
State the equation of state for an ideal gas
|
PV=nRT
R=8.31Jmol-1K-1
P-pressure/V-volume/n-number of moles/R-gas constant/T-temperature
|
|
10.1.2
Describe the difference between an ideal gas and a real gas
|
Ideal Gas
Real Gas
- Gas that obeys ideal gas law equation
- In high pressure or low pressure, real gas condense to
liquids and solidify
- There are intermolecular forces present
- Collisions are not perfectly elastic
|
|
10.1.3
Describe the concept
of the absolute zero of temperature and the
Kelvin scale of temperature
|
 Refer to image |
|
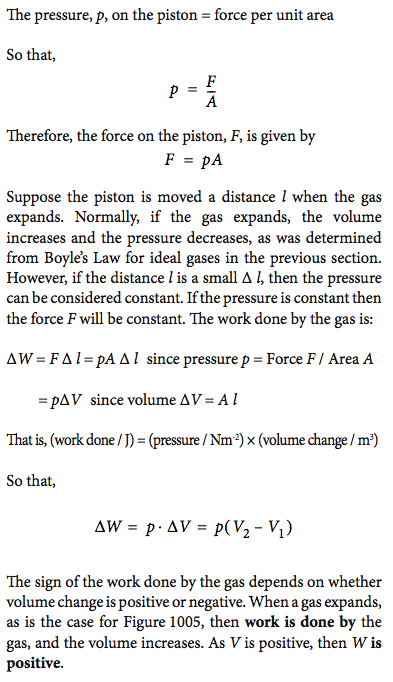
10.2.1
Deduce an expression for the work involved in a volume change of a gas at constant pressure
|
 Refer to image |
|
10.2.2
State the first law of thermodynamics
|
First Law of Thermodynamics – The
thermal energy transferred to a system from its surroundings is equal to the
work done by the system plus the change in internal energy of the system.
OR
Q=∆U + W
|
|
10.2.3
Identify the first
law of thermodynamics as a statement of the
principle of energy conservation
|
The
first law of thermodynamics is a statement of the Law of Conservation of Energy
in which the equivalence of work and thermal energy transfer is taken into
account
|
|
10.2.4
Describe the
isochoric (isovolumetric), isobaric, isothermal and
adiabatic changes of state of an ideal gas
|
Isobaric Process
Pressure
is constant
Expansion
– Volume increases -> work is positive -> Q increases -> thus
temperature increases
Compression
- reverse
Isochoric (isovolumetric)
Process
Volume is constant
Expansion – work is zero ->
thermal energy leaves the system -> Q is negative -> internal energy is
negative -> temperature decreases
Compression - reverse
Isothermal Process
Temperature is constant
Expansion – internal energy is
zero -> work is done by the gas (+) -> Q is positive
Compression - reverse
Adiabatic Process
Q=0 (no heat transfer)
Expansion – internal energy =
-W -> work done by the gas -> volume decreases -> temperature
increases
Compression - reverse
|
|
10.2.5
Draw and annotate thermodynamics processes and cycles on P-V diagrams
|
 Refer to image |
|
10.2.6
Calculate from a P-V diagram the work done in a thermodynamic cycle
|
Work is the AREA of P vs. V graph where the area is the enclosed region
that the graph and x-axis creates
|
|
10.3.1
State that the second law of thermodynamics implies that thermal energy
cannot spontaneously transfer from a region of low temperature to a region of high temperature
|
The Second Law of Thermodynamics implies that thermal energy cannot
spontaneously transfer from a region of low temperature to a region of high
temperature
|
|
10.3.2
State that entropy is
a system property that expresses the degree of
disorder in the system
|
Entropy – a system property that
expresses the degree of disorder in the system
Entropy is a thermodynamic function of the state of the system and can be
interpreted as the amount of order or disorder of a system
|
|
10.3.3
State the second law of thermodynamics in terms of entropy changes
|
Change in entropy of a system when an amount
of thermal energy Q is added to a system by a reversible process at constant
absolute temperature T is given by
∆S=,Q/T
Or the total entropy of the
universe is constantly increasing.
|
|
10.3.4
Discuss examples of
natural processes in terms of entropy changes.
Examples of entropy changes
|
Ex 1) Chicken growing inside an egg
è
from an
orderly yellow and white distinction, young chick’s body forms and disorder
increases. Thus, entropy increases.
Ex 2) Ice – melting
When ice melts, it lowers the temperature of the surrounding, so it reduces
entropy of surrounding while the ice increases in entropy
|


