Cards In This Set
| Front | Back |
|
Residual plot
|
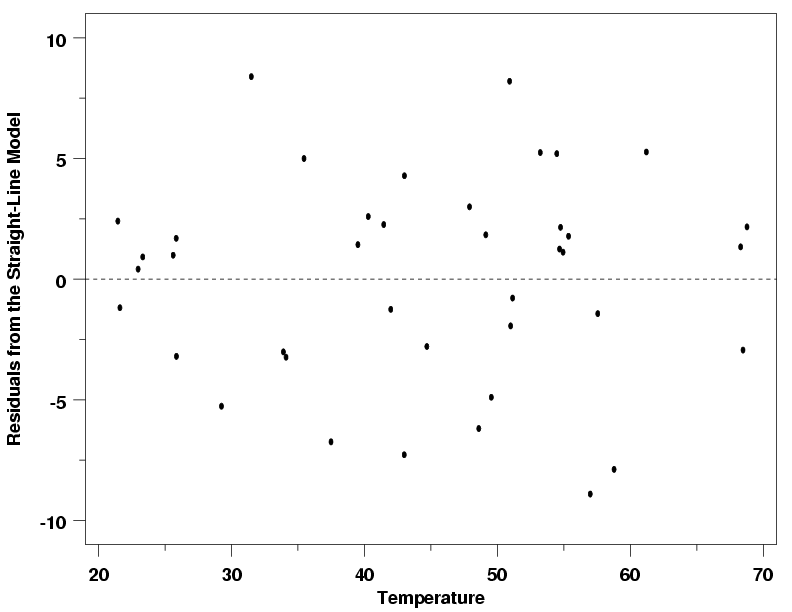 A scatterplot of regression residuals against the explanatory variable and assesses the fit of a regression line; the sum or the mean of its residuals always equals 0. |
|
Residual
|
 The difference between an observed value of the response variable and the value predicted by the regression line. |
|
Scatterplot
|
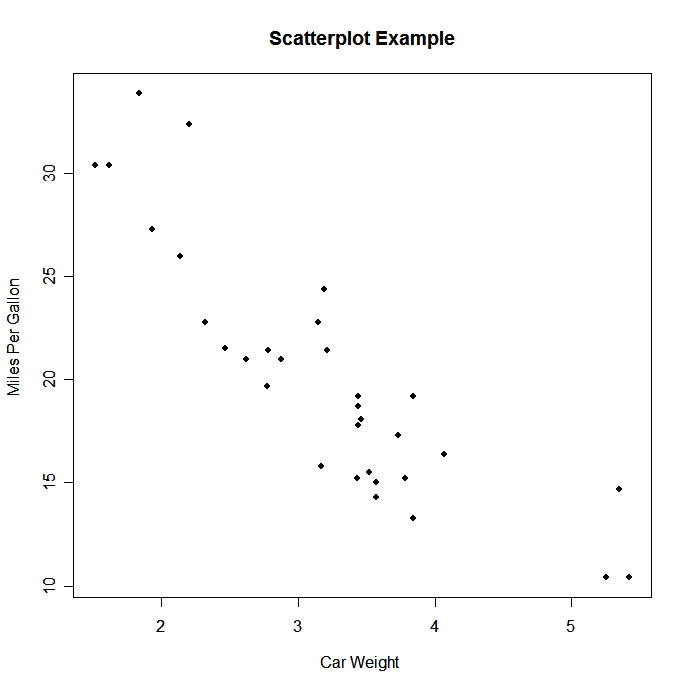 The most effective way to display a relation between 2 quantitative variables |
|
Four categories to describe overall pattern of bivariate data
|
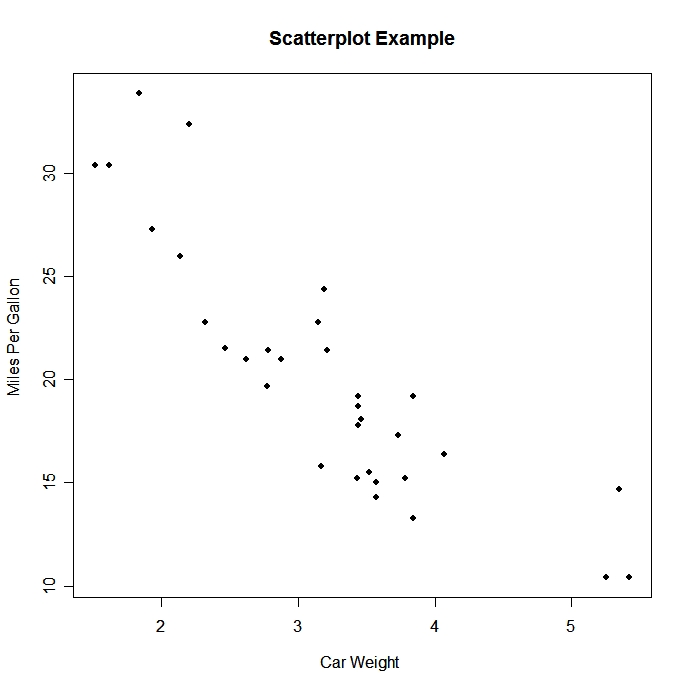 Form: clusters, gaps Direction: positive or negative association Strength: how strong is the association Influential points: outliers or points that fall outside the overall pattern of the relationship Example: Form: There's a cluster from 2-3 and 3-4 on the car weight. There's a gap between 4 and 5. Direction: negative association Strength: moderately strong Influential Points: any point above 5. |
|
Positive versus negative association
|
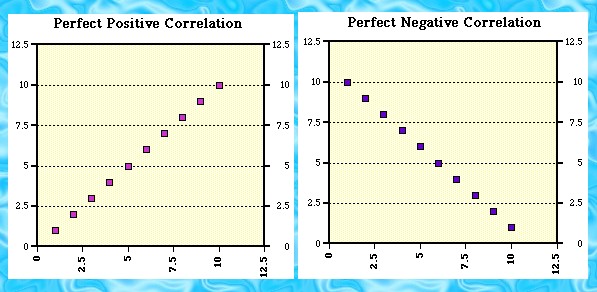 A positive association has a correlation above 0, while a negative association has a correlation below 0. |
|
Correlation
|
 R; measurement between 2 quantitative variables to see the direction and strength of a linear relationship of a scatterplot |
|
Coefficient of determination
|
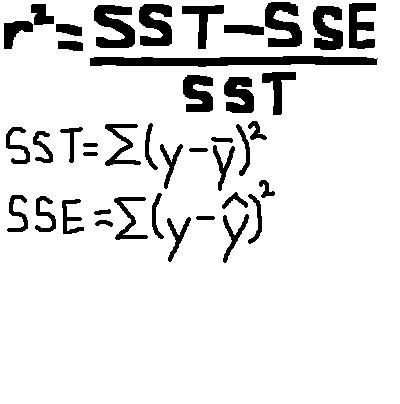 . r2; variation in y that's explained by the LSRL of y on x. Wording: (r2)% of the variation is explained by the LSRL(y-hat=a+bx) with ____ as the explanatory variable x and ____ as the response variable y." |
|
Least squares regression line
|
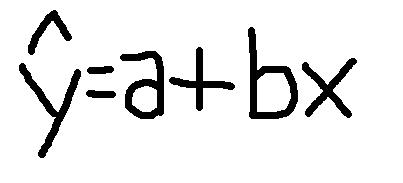 Of y on x: makes the sum of the squares of the vertical distances of points from the line as small as possible. a=y-intercept b=slope ^ y=predicted y |
|
Slope formula “b” for regression line
|
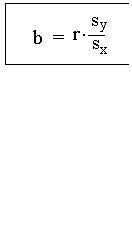 B=r(sy/sx) |
|
Intercept formula “a” for regression line
|
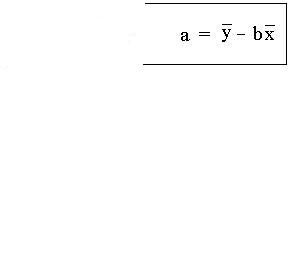 _ _ a=y-bx |
|
Seven “facts” about correlation
|
1. Correlation makes no distinction between explanatory and response variables.
2. Correlation requires that both variables be quantitative, so that it makes sense to do the arithmetic indicated by the formula for r. 3. Because r uses the standardizes values of the observations, r does nor change when we change the units of measurement of x, y, or both. 4. Positive r indicates positive association between the variables, and negative r indicates negative association. 5. The correlation r is always a number between -1 and 1. 6. Correlation measures the strength of only a linear relationship between two variables. 7. Like the mean and standard deviation, the correlation is not resistant: r is strongly affected by a few outlying observations. |
|
Response variable/explanatory variable
|
Response variable: measures an outcome of a study; dependent variable
Explanatory variable: attempts to explain the observed outcomes; independent variable
|
|
Bivariate data
|
A scatterplot of regression residuals against the explanatory variable and assesses the fit of a regression line; the sum or the mean of its residuals always equals 0. Data that shows the relationship between two variables
|
|
Influential point
|
An extreme point on the x-axis direction that influences the regression line.
|


